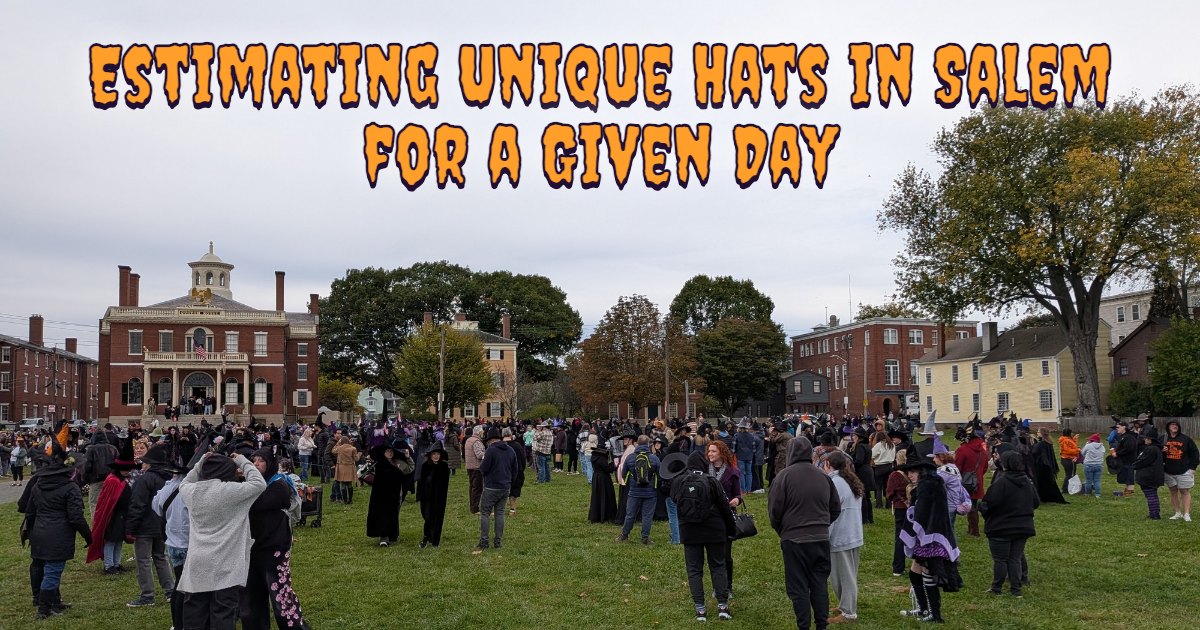
Do we know how many duplicates there are?
If you have multiple people observing hats independently, and they are not altered or moved, you can compare the duplicates and non-duplicates between their lists. With two observers' counts N₁ and N₂, you can use the Lincoln-Petersen Index if you know R, the number of hats both counters saw.
The index formula is:
However, we don't know R, the number of overlap. Also, hats move around as well as enter and leave Salem all day long.
Unmarked Population Model
We might be able to use the Unmarked Population Model used in ecology for counting unmarked moving animals. We can estimate the speed of a counter as walking speed. Hats are on people that are trying to go to places or events in Salem. Often, they have to stand in line and be motionless for periods of time. Let's say they move slower as a result.
Let's say a counter walks normally, or as normally as one can in crowded Salem. Let's say this is about 2.5 mph.
A hat wearer will often walk much slower, sometimes as a result of having to wait in a long line to get into a shop or restaurant. Let's say they walk about 1 mph.
We'll estimate hats and counters stick to the half of a square mile area centered around Old Town Hall, extending over to the start of Chestnut Street/Ropes Mansion, and over to the Salem Ferry terminal, up to the Salem commuter rail station, and down to Far from the Tree.
This gives us the formula:
where:
- D is the density of hats: how many different hats there are per square mile.
- E is the encounter rate: how many hats one counter spots per hour.
- W is the detection distance, in miles: how far to either side of their path a counter notices a hat.
- 5.20 is twice the average speed, in mph, at which hats and a counter move past each other. With a counter at 2.5 mph and hat wearers drifting at 1 mph in every direction, that average works out to 2.60 mph. It is doubled because a counter sees hats on both sides of their path, a strip 2W wide.
Dividing hats per hour by miles and by miles per hour leaves hats per square mile.
Multiplying that density by our half a square mile gives how many hats are in the area at one time:
That is a snapshot while the counter is walking, not the whole day: people come and go, so more different hats pass through over a day than are there at any one moment.
We'll be looking closely at this, see how we can map it onto the data we have and the data moving forward.